DPU 3
Data Preparation Unit for XTomo-LM 3 (DPU 3)
Purpose
XTomo-LM input data are stored in an ASCII file of the SRT format. Each file line contains source and receiver IDs and positions,wave code and traveltime. Extracting this information from large volumes of field data and making up an SRT file is a self-contained complex problem which cannot be solved without special software. DPU is just that kind of software. The DPU input data consist of a set of common source point seismograms, each one in a separate SEG-Y/PC file, and, possibly, additional ASCII files with positional data. DPU requires that these files follow the "shots–stations–relations" model. Thus, positional data are either contained in seismogram trace headers or in three ASCII files. When seismic stations are used as receiver devices (ocean bottom stations or land stations), seismic traces are, naturally, gathered in common receiver point seismograms. DPU can be applied straight to this case as well, because we can treat the observation system as inverted, and formally interchange sources and receivers. For example, we can regard an OBS as a source and the airgun shot point as a receiver. If necessary, DPU can invert observation system back at the time of creating SRT file.
The observed data transformation from the form "CSP seismograms + positional data" to the SRT format suggests solving the following problems:
1.Import of the field data and creating geometry database.
2.Transformation of coordinates.
3.Picking wave arrival times.
4.Creating target file.
Transformation of Coordinates
SRT file contains coordinates of sources and receivers in 2D coordinate system (X', Y') used in XTomo-LM. The X' axis is directed the along the observation line, while the Z' axis – vertically upward. Meanwhile, the data delivered by a field crew are described in coordinate system of its own, usually UTM. In DPU, it is supposed that positional data are represented in a local 3D coordinate system (X, Y, Z) with the Z axis directed vertically upward. Thus, DPU must carry out the transformation
(1) (x, y, z) → (x', z').
Depending on the conditions of observations, source and receiver positions may, more or less significantly, diverge from the planned seismic line. Therefore, posing the problem in the form (1) may prove irrelevant. The approach used in DPU is based on pessimistic assumptions about the conditions of observations. DPU builds observation system on a line defined by source positions in such way that it is kinematically as close to the experimental as possible. In particular, it keeps receiver offsets intact which is crucially important for arrival time interpretation.
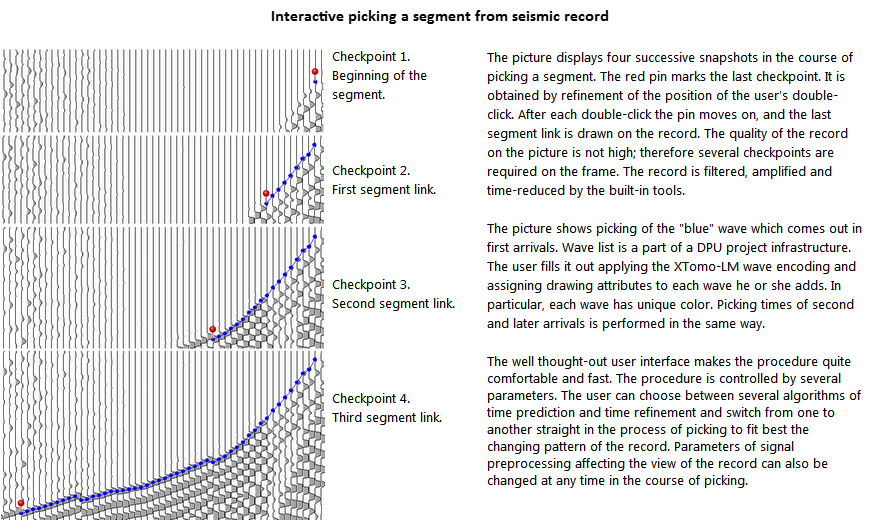
Picking arrival times
Declining the exact implementation of the phase correlation procedures, which are too sensitive to seismic record quality, DPU uses interactive approach, in which the user double-clicks specific signal phases on the record between which arrival times are predicted and refined with simple and fast algorithms. The clicked phases are called checkpoints. Record quality influences only a number of checkpoints needed to pick a phase lineup. A picked lineup represents a segment of a wave traveltime curve (segment, for short). The user can pick first and later arrivals of different seismic waves. A segment may contain one point as well. This picture gives further details. The result of picking from a seismogram is a set of segments structured by waves. It is stored in a local database called arrival map and represents kinematic picture of the wave field. To make decision on wave identification, one often wants to view wave arrivals picked from the entire profile or to do some modeling. DPU meets both needs: one can make up and study line arrival map, while results of modeling in XTomo-LM can be displayed over seismogram images (see below).
Application area
1. Seismic profiling. DPU input data may be acquired in the course of profiling with cables or streamers or seismic stations as receiver devices. Positional data can be represented in 3D coordinate system (X, Y, Z) or 2D coordinate systems (X, Z) or (Y, Z). The former case is called 2.5D profiling, the other two – 2D profiling, to use DPU terminology.Such distinction is motivated by the problem of coordinate transformation. In case of 2D profiling, X or Y axis runs along the seismic line.
2. Other 2D observations. Any observations using 2D coordinate system in positional data can be input in DPU if seismic records can be represented in the form of CSP or CRP seismograms. Borehole or crosshole study is a good example.
DPU + XTomo-LM
Usually, there is one-way connection between DPU and XTomo-LM: DPU exports an SRT file and XTomo-LM imports it as input data. For two important tasks a two-way channel is used.
1. Displaying kinematic modeling results on seismogram images. To fulfill the task, DPU can export only source-receiver configuration from geometry database in order to import it into an XTomo-LM modeling project. After getting solution to forward problem, DPU can fetch the solution straight from XTomo-LM database and display it over a seismogram image (possibly, together with picked stuff).
2. Computation and introducing static corrections in CMP data. In CMP technology, seismic tomography is often used for study of velocity in the upper low-velocity layer to compensate for referencing positional data to a new datum – a horizontal line. This problem can be solved by DPU and XTomo-LM in full. The result includes time corrections for every station and every horizontal line from a user-defined set. They are stored in an ASCII file.
DPU has English user interface and is delivered with context help system and documentation in English and Russian.